
No Job is Too Big or Too Small!

What Is a UV Spectroscopy Machine and How Does It Work

A Uv Spectroscopy Machine measures how much ultraviolet or visible light a sample absorbs at selected wavelengths. In a laboratory, the process may begin with a clear quartz cuvette, a prepared blank, and a small liquid sample. The instrument directs light through the sample and records the detector’s response. That sounds simple. Reliable results depend on careful setup, clean optics, and suitable measurement conditions. The Beer–Lambert law links absorbance with concentration and path length, but real samples do not always behave ideally.

Professional guidance helps explain what performance means. ASTM E275-08(2023), Standard Practice for Describing and Measuring Performance of Ultraviolet and Visible Spectrophotometers, addresses instrument performance and measurement terms. The United States Pharmacopeia’s General Chapter <857>, Ultraviolet-Visible Spectroscopy, provides further technical guidance for this analytical method. These references matter because wavelength accuracy, absorbance accuracy, and routine checks affect confidence in results. But samples vary. Turbidity, solvent choice, stray light, and an incorrect blank can all distort a reading.

This article explains the machine’s main components and how light travels from source to detector. It also introduces absorbance spectra, common laboratory uses, and practical checks that help produce interpretable data. The details can look less tidy at the bench than in a diagram. That is worth remembering. A spectrum is useful evidence, not an automatic guarantee that a sample or conclusion is correct.
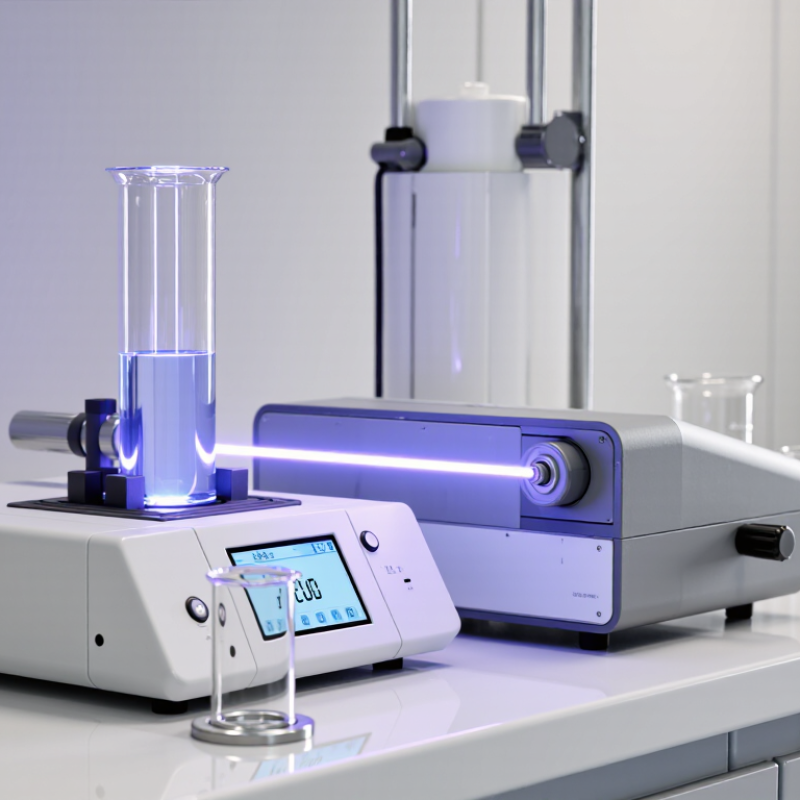
What Is a UV Spectroscopy Machine and How Does It Work

What a UV Spectroscopy Machine Is and What It Measures

A UV spectroscopy machine, often called a UV-Vis spectrophotometer, measures how much ultraviolet or visible light a sample absorbs. It sends selected wavelengths through a sample held in a clear cuvette, then compares the light reaching a detector with a reference measurement. A small screen or connected computer displays the result as absorbance or transmittance across wavelengths.

The instrument measures light behavior, not a substance’s identity by itself. Many molecules absorb particular wavelengths because of their chemical structure. For example, a colored solution may absorb some visible wavelengths more strongly than others. In a suitable, clear sample, absorbance can help estimate concentration using the Beer-Lambert relationship. The result depends on factors such as path length, sample preparation, and instrument setup.

Details matter. A blank helps account for absorption from the solvent and cuvette, while fingerprints or bubbles can distort readings. Some samples scatter light or contain several absorbing substances, making interpretation less direct. A spectrum can suggest what is present, but it is not always proof. I would treat a neat-looking graph with care; the sample may be less simple than it appears.

The Main Components of a UV Spectroscopy Machine

A UV spectroscopy machine turns light absorption into a measurable signal. Its main components are a light source, wavelength selector, sample holder, detector, and readout system.

The lamp supplies ultraviolet light, often from a deuterium source, while a tungsten-halogen lamp may cover visible wavelengths. A monochromator uses a grating to isolate a narrow wavelength band. The selected light passes through a cuvette containing the sample.

Small parts matter. Fingerprints or a scratched cuvette can distort the reading.

After the light exits the sample, a photodiode or photomultiplier measures its intensity. Software compares this value with the original beam and calculates absorbance.

NIST’s SRM 2034 wavelength-standard certificate lists certified absorption features near 241 and 287 nanometers, useful for checking wavelength accuracy. ASTM E275-08(2022) also describes practices for assessing UV-visible instrument performance.

These checks matter because wavelength errors can shift an absorption peak and affect interpretation. Even a well-specified instrument can drift after handling or lamp aging.

The detector is not the whole story; alignment, clean optics, and consistent cuvette positioning matter too. A tidy screen can still hide a poor measurement.

How the Machine Directs Ultraviolet Light Through a Sample

A UV spectroscopy machine guides light through a sample in a carefully controlled path. A lamp produces ultraviolet radiation, and an optical system selects a narrow band of wavelengths. Mirrors and slits steer that light toward a cuvette, usually made from UV-transparent material. Ordinary glass can absorb some ultraviolet light, distorting the reading. A narrow beam. The instrument records how much light passes through the sample and how much is absorbed.

The detector compares transmitted light with a reference measurement. Software converts the difference into absorbance, which can help estimate a substance’s concentration when conditions are controlled. The NIST certificate for Standard Reference Material 2034 lists 14 certified absorption-peak positions for checking wavelength accuracy. This gives laboratories a practical way to test whether the machine selects the intended wavelengths. Small errors matter. Fingerprints, bubbles, a scratched cuvette, or a slightly misaligned holder can change the signal. In routine work, I would inspect the cuvette and repeat a questionable scan rather than trust a tidy-looking curve. Even a calibrated instrument cannot correct a poorly prepared sample.

How Absorption Data Is Converted into a Spectrum

A UV spectroscopy machine turns light loss into a wavelength-by-wavelength record. A lamp sends ultraviolet light through a monochromator, which selects a narrow wavelength band. The detector measures light before and after it passes through the sample. Not yet a spectrum. Software converts the readings using absorbance, A = −log10(T), where T is transmitted light divided by incoming light. If a sample transmits 10% of the light, its absorbance is 1.000; at 50%, it is about 0.301. These values follow the Beer–Lambert relationship between absorbance, concentration, and optical path length.


The instrument repeats this measurement across a wavelength range, then plots absorbance against wavelength. A peak may indicate where the sample absorbs strongly; its height can support concentration estimates when conditions are controlled. NIST’s SRM 2034 certificate lists holmium oxide wavelength reference peaks, including 241.1 nm and 279.4 nm, for checking wavelength calibration. ASTM E275-08(2022) identifies wavelength accuracy, photometric accuracy, and stray radiant energy as key spectrophotometer performance measures. Real instruments are not perfect. A fingerprint on the cuvette, an incorrect blank, or stray light can distort the curve. Even a clean-looking spectrum deserves a quick check against the sample preparation and instrument settings.

Common Applications and Factors That Affect Results

A UV spectroscopy machine measures how much ultraviolet light a sample absorbs at selected wavelengths. In routine laboratories, this helps estimate concentrations using a calibration curve or the Beer–Lambert relationship. Researchers may track protein or nucleic acid concentrations, check water samples for absorbing compounds, or follow a reaction as its colorless components change. In quality control, repeat measurements can reveal whether a batch differs from an established range. Small details matter.

Results depend on more than the instrument. The chosen wavelength must suit the substance being measured, and a poorly prepared blank can shift the baseline. Fingerprints, scratches, or droplets on a cuvette may scatter light; even turning the cuvette between readings can change the result. Turbid samples, unsuitable solvents, and changes in pH can also affect absorption. Very concentrated samples may exceed the instrument’s reliable range, so dilution and a fresh calibration check may be needed. Temperature and light-sensitive samples deserve attention, too. It is easy to trust a clean-looking spectrum too quickly; recording preparation steps and repeating a measurement can expose small handling errors.

What Is a UV Spectroscopy Machine and How Does It Work? Common Applications and Factors That Affect Results
Topic Item How It Works or Typical Use Practical Notes
Instrument Basics and Measurement
Instrument definition UV-visible spectrophotometer An analytical instrument that measures how much ultraviolet or visible light a sample absorbs or transmits at selected wavelengths. Many instruments cover approximately 190–800 nm, though the usable range depends on the model, light source, detector, and optics.
Light path Light source, wavelength selector, sample holder, detector Light from a source is directed through a monochromator or filter, passed through the sample, and measured by a detector. Deuterium lamps are commonly used for UV wavelengths; tungsten-halogen lamps are commonly used for visible wavelengths.
Measurement principle Absorbance and transmittance The instrument compares the light intensity through a sample (I) with the reference intensity (I₀). Absorbance is calculated as A = log₁₀(I₀/I). Higher absorbance means less light reaches the detector at that wavelength.
Quantification Beer–Lambert law For suitable conditions, absorbance is proportional to concentration: A = εbc, where ε is molar absorptivity, b is path length, and c is concentration. Use a calibration curve or a validated absorptivity value. Linearity can fail at high concentrations or when chemical conditions change.
Sample container Cuvette and optical path length A 10 mm path length is a common standard for conventional cuvettes. Quartz or other UV-transparent cuvettes are generally required for UV measurements. Ordinary glass and many plastics absorb UV light; check the material’s transmission range.
Common Applications
Biochemistry Nucleic acid concentration DNA and RNA absorb strongly near 260 nm; absorbance can be used to estimate concentration when the sample and method are appropriate. The A260/A280 ratio is often used as a purity check. Values near 1.8 for DNA and 2.0 for RNA are common reference points, not universal acceptance limits.
Biochemistry Protein measurement Proteins absorb near 280 nm mainly because of aromatic amino acids. Colorimetric protein assays are also measured at assay-specific wavelengths. Common assay read wavelengths include about 562 nm for BCA and about 595 nm for Bradford; follow the assay protocol and reagent instructions.
Pharmaceutical analysis Assay and quality control Absorbance at a validated wavelength can be used to determine the concentration of an absorbing drug or compound. The wavelength, solvent, calibration range, and sample preparation are method-specific and should be validated for the intended product.
Environmental testing Nitrate screening in water UV absorbance near 220 nm can be used in some methods to estimate nitrate in water samples. Dissolved organic matter can also absorb UV. Some methods apply a correction near 275 nm; use the applicable standard method and account for interferences.
Chemistry and materials Reaction monitoring and spectral characterization Changes in absorbance or spectral shape can track the formation, consumption, or identity of light-absorbing species. Choose wavelengths that are informative for the compound and control for solvent, pH, temperature, and reaction timing.
Factors That Affect Results
Wavelength selection Wavelength accuracy and bandwidth Measurements depend on selecting the intended wavelength and using an appropriate spectral bandwidth. Wavelength errors or a bandwidth that is too broad can change measured absorbance, especially near sharp spectral peaks.
Instrument performance Stray light, baseline, and detector condition Stray light reaching the detector can make absorbance readings appear lower than expected, particularly for strongly absorbing samples. Warm up and maintain the instrument as directed, run a suitable blank, and verify performance with appropriate quality-control checks.
Sample preparation Concentration and dilution Beer–Lambert behavior is most useful within a method’s validated linear range. Samples that are too concentrated may give unreliable results. Dilute them appropriately and include dilution factors in calculations.
Reference measurement Blank composition A blank accounts for absorbance from the solvent, reagents, and cuvette when it is prepared to match the sample matrix. A mismatched or contaminated blank can shift the baseline and bias the sample result.
Optical quality Cuvette cleanliness and orientation Fingerprints, scratches, droplets, or inconsistent cuvette placement can scatter or absorb light. Use clean, matched cuvettes; handle optical faces by the edges and keep orientation consistent when required.
Sample condition Turbidity, bubbles, and particulates Suspended particles and bubbles scatter light, so apparent absorbance may not represent molecular absorption alone. Prepare samples consistently and use an appropriate clarification or measurement method when scattering is present.
Chemical environment Solvent, pH, and temperature These conditions can alter a compound’s chemical form or absorption spectrum. Match measurement conditions to the validated method and keep standards and samples under comparable conditions.